| Device Monitor | |
| Device Monitor |
|
Stay in Control. Stay Connected. |
 |
|
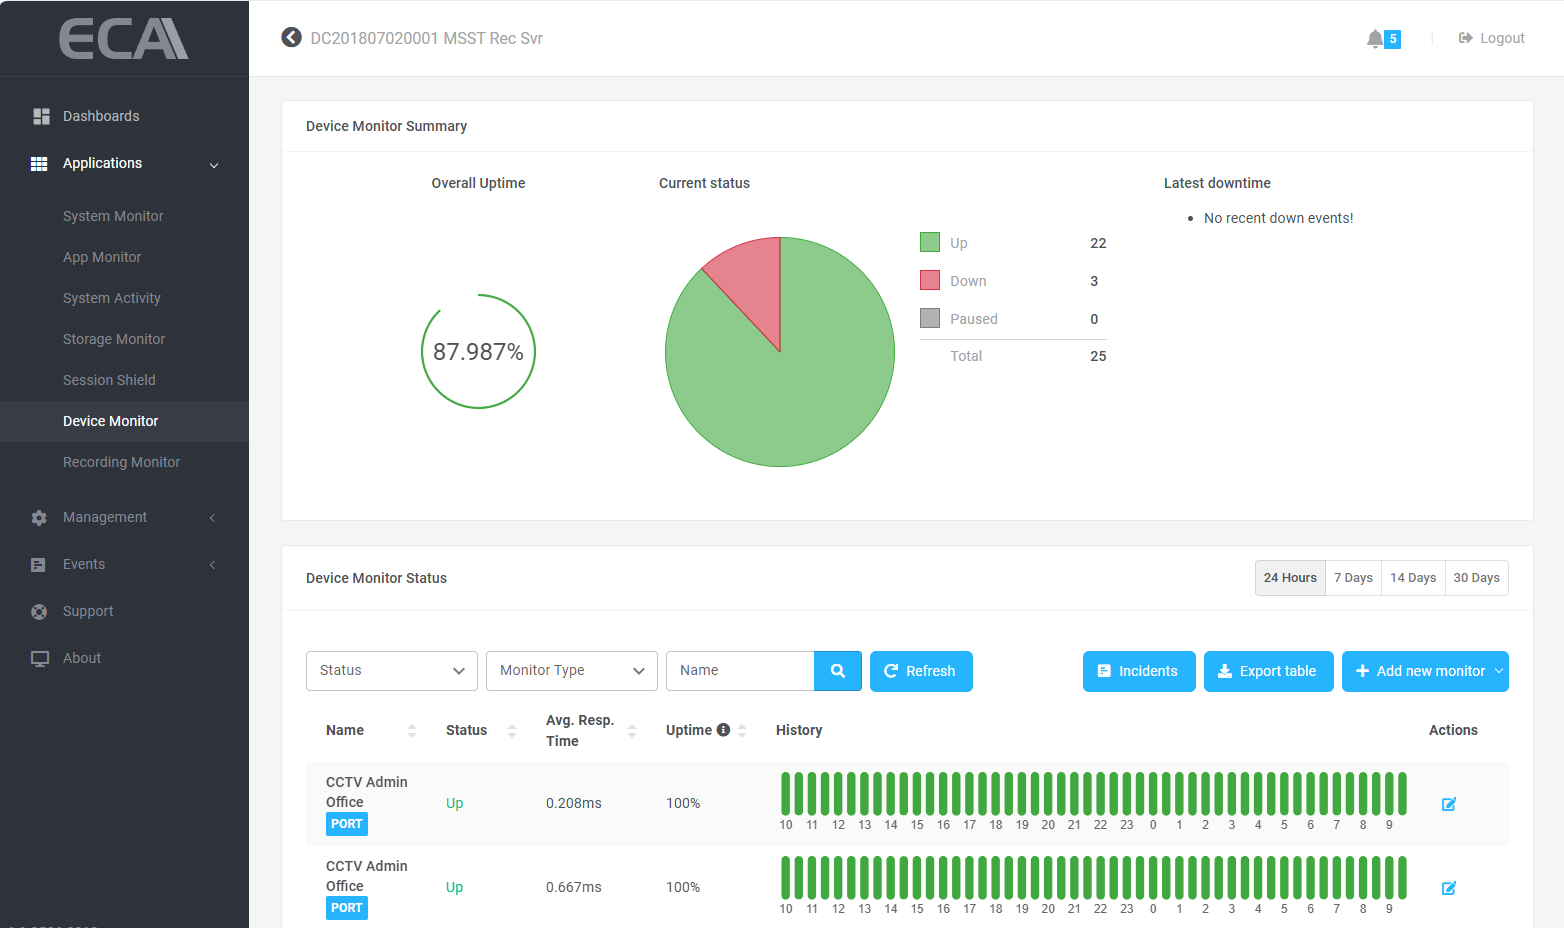
Graphical Insights Summary Tab It shows the overall uptime percentage consolidated across all devices, giving you an instant snapshot of reliability. The Current Status further breaks down the number of devices that are currently up and those that are down, making it easy to assess system health at a glance. Visual Timeline View Displays device uptime and downtime in a clear, time-based chart, helping you easily pinpoint when and where issues occur. Device Overview Dashboard Further enhances visibility by showing the status of every connected IoT device with intuitive color-coded indicators—green for devices that are online and red for those that are offline. 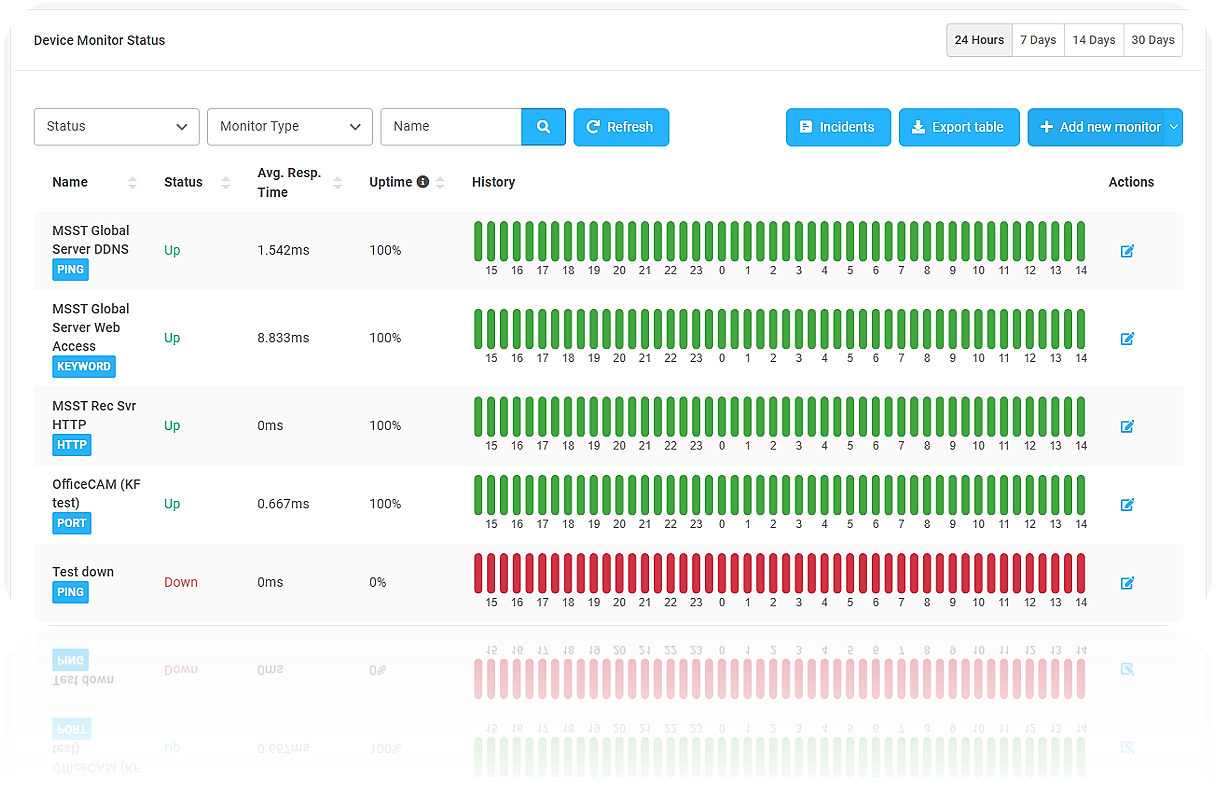
|
|
Monitoring Methods
HTTP Monitoring Supports GET, POST, HEAD, OPTIONS requests • Customizable intervals for precise monitoring Keyword Detection Verify if a keyword is found / not found in response • Ideal for content or service validation Ping Monitoring Ping IP addresses to confirm device availability • Ping ports to validate application or service health 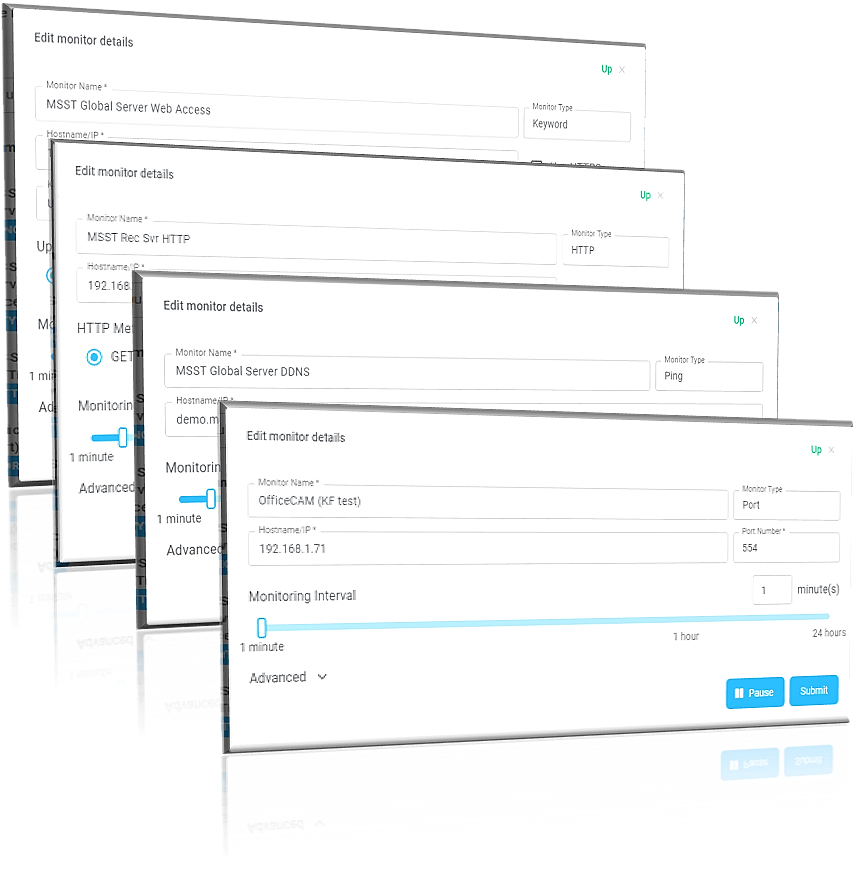 |
|
Data Export
& Reporting The Export & Reporting feature makes it simple to share and analyze results. All monitoring data can be exported into CSV files, allowing you to create detailed uptime reports for audits, compliance, or deeper analysis with just a few clicks. 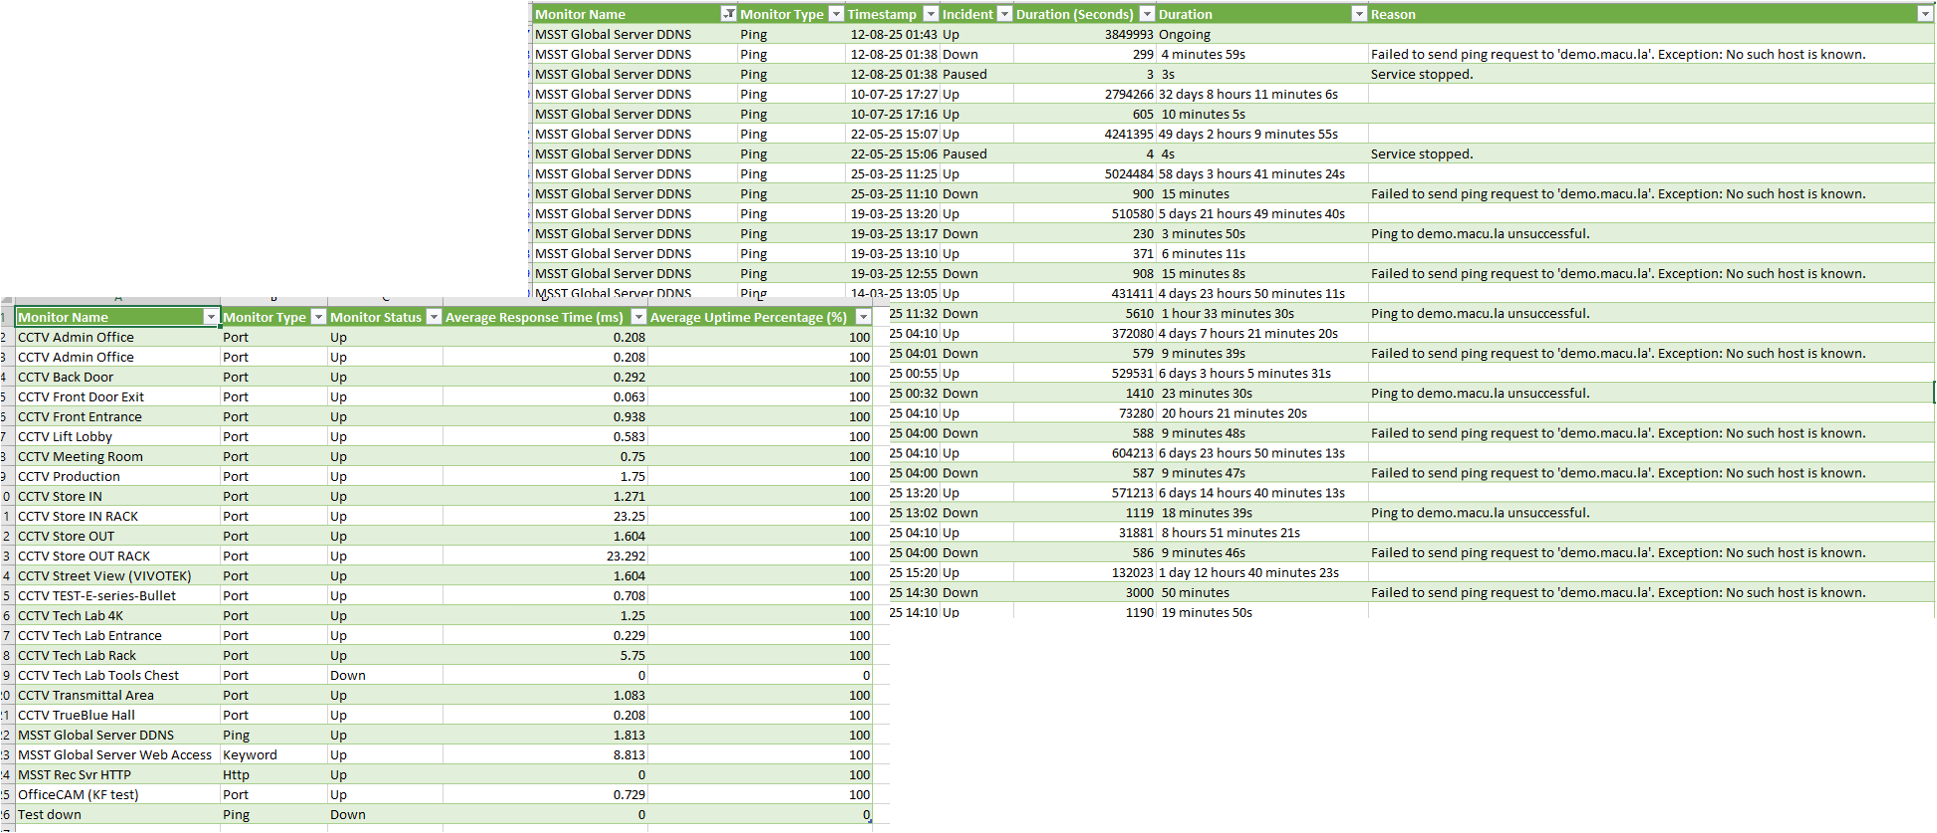
|
Why Choose Device Monitor?
|
| Action now > |
|
||||||
|
|